By Astha Mehta & Nayan Saraf
Edited by Sachit Modi
Introduction
Since the inception of the financial market, the interest rate has had a significant impact on various financial assets. The direct impact can be seen on the bond prices, which have an inverse relation with the interest rates. It also affects the deposit and lending pattern in the sense that with the fall in interest rates, the deposits decreases while the lending increases and vice-versa.
However, the impact is not just limited to the change in the saving and investment behavior of the individuals and bonds, but also extends to the valuation of various financial assets like stock prices, currency, real estate etc. This can be explained using the Gordon’s Model. The model explains the valuation of an enterprise by discounted cash flow method. For example, any firm giving regular dividends, say $100, will have different values for different interest rates. When the interest rate (r) is low, say 1%, the value of the firm is, 100/r, i.e. $10,000. But as the interest rate goes on increasing to 25%, the value of the firm exponentially declines to $400. This is one of the reasons why in the low-interest rate regimes, the price of assets are high and vice versa. This is shown in Figure 1.
Similarly, the currency value is also influenced by the interest rates. Although, there are various factors affecting exchange rate, like economic stability, domestic good’s demand etc., but interest rate has a significant effect on the appreciation and depreciation of the currency. A decrease in interest rate is unattractive for foreign investors resulting in shifting of foreign investments to other countries with relatively higher returns. This weakens the domestic currency. As currency loses value, investors look for other investment sources like gold and real estate. Thus, the effect percolates down to these assets also.
These changes in the value of the assets cause investors to modify their portfolio holdings. There have been instances throughout history where the change in the interest rate has driven investors to alter their portfolio in such a way that asset bubbles were created. Now let’s look at some of the major asset bubbles which stirred the global economy.
U.S. Housing Bubble
The U.S. housing bubble is a perfect example where the lower interest rate was one of the key reasons to inflate the housing prices. The lower interest rate had given the opportunity to the investor to buy the house when the money was virtually free . The common explanation for the lower interest rate goes back to the hypothesis of “Global Saving Glut” by Ben Bernanke, Ex Fed Chairman. According to Ben, prior to the housing bubble, there was an excessive saving generated in the emerging market which was channelized to the U.S. market, and subsequently lowered the long-term real interest rates. He argued that a shortage of safe assets could also have contributed to the problem.
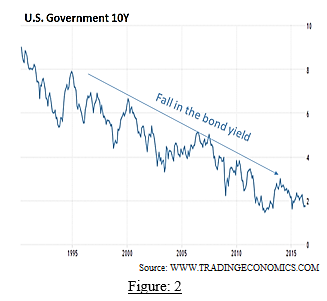
This fact could have been evident from the yield of 10Y U.S. Government bond, where the lower real interest rate has reduced the bond yield from a high of 8% in 1995 to as low as 4% before the housing bubble (Figure 2).
Now this lower bond yield had caused the investors to shift to other risky investments. And real estate seemed to be an ideal choice for the investors then. During the post dot-com bubble era, the effective Federal Fund Rate was reduced dramatically from 6.5% to just 1%. This long-term lower interest rate had resulted in the dramatic increase in the asset prices (Housing). By 2006, this interest rate was normalized from 1% to 5.25% and people started regretting the exorbitant prices they paid for the assets which were overvalued. It brought about lower demand and increased monthly payments for adjustable rate mortgages. Soon after that, a series of defaults started, resulting in the bursting of the bubble. Figure 3 explains the same.

However, it is not completely true that the lower interest rate was the only reason which created this bubble. As Raghuram Rajan argued in his book, “Fault Lines”, that if there are other factors that encourage investment in a single asset, then the impact is amplified to an extent that asset bubbles are created. 2 This phenomenon was clearly evident in the housing bubble of 2007 when not only interest rate but also government policies like home buyer’s credit, easy lending practices, Fed’s focus on job creation rather than output, inefficiency of credit agencies etc. were equally culpable for it.
Japan’s Real estate bubble
A similar scenario can be seen in Japan’s real estate bubble. The Japan asset bubble started when US dollar depreciated against the yen due to the signing of the Plaza Accord by the US with Germany, England, France and Japan. The dollar depreciation boosted US exports, but at the same time made investors shift investments from the US to Japan due to foreign exchange fluctuations.
The rising value of yen hindered business opportunities for Japanese exporters. To protect its export market, Bank of Japan resorted to monetary easing by lowering the interest rates from 5 percent in 1985 to 2.5 percent in the early 1987. The free lending by Japanese banks increased the real estate and stock purchases which inflated the value of land and stocks. During this period, Nikkei tripled to 39,000 and real estate prices reached a record high. It was even rumoured that during this phase the Tokyo Imperial Palace was worth more than the entire state of California. The price rise continued for four years, until 1989, when BOJ finally increased interest rates on account of inflationary pressures, and caused the asset bubble to burst.
The Nikkei plunged from 39,000 to 20,000 in 1990 and retail loans became NPAs which resulted in the Japanese government to take twenty years to recover back to the pre bubble economy which is now commonly referred as the lost two decades.


The Japan debt crisis was also a result of lower interest rates. Lower interest rates allow governments to fund its economic spending through cheap debt. A part of government’s revenue is used to pay interest on the debt taken. When interest rates are kept low for a long period, the government’s borrowing increases and so does the interest payments. Later on, if there is an increase in the interest rate, the interest payment shoots up consuming a large part of or sometimes whole of the government’s revenue. This creates a vicious debt trap.
Shale oil production bubble
Shale oil production is another case where the low-interest rate had fuelled the gas drilling bubble. Since the crisis of 2007, Fed had kept the interest rates constant, nearly zero, which resulted in loose money being poured into the capital intensive oil drilling process for years. When these investments became successful, there was an excess supply of oil in the world economy. Since, in just a period of one year, the price of oil plummeted from $120 a barrel to just $30 a barrel, the shale oil production (drilling industry) busted.
There are more than 50 shale oil production companies in the U.S. and more than half of them have already filed for bankruptcy due to the plunging oil prices. None of these oil companies are able to reach the break-even point. And the ones who haven’t filed for bankruptcy are running in huge losses.
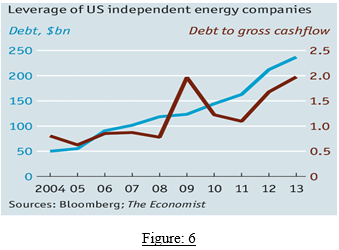
Now, the Fed has again increased the interest rate by 0.25 basis points and it would have negative consequences for these oil companies. Firstly, it would lead to an additional debt cost in their balance sheets. Figure 6 clearly indicates there is an increase in debt due to cheap lending and also, the increase in debt to gross cash flow, due to lower generation of cash flow from the operations. Second, the higher interest rate will increase the cost of capital, which would mean that these stressed drill companies would lose access to finance. Third, the higher interest rate will result in the appreciation of the dollar, leading to downward pressure on oil prices, due to crude oil being priced in dollars.
Conclusion
Central Banks undertake monetary easing often by lowering interest rates, in order to stimulate the economy, but more often than not, end up in creating an asset bubble. The various historic events highlight the role that interest rates have played in the financial market and its effect on the asset prices.
Even though, these events indicate that various factors contributed to the loss of wealth due to bubble formation, investors sometimes ignore the risk and fall into the trap of increasing asset prices. It is also noteworthy that the dot-com bubble burst after the Fed had increased the interest rate by 1.91% in 1999-2000. More interestingly, the current US housing index shows that the US house prices have reached to new heights while the interest rates are nearly zero. So, are we heading for another bubble? Well, it is difficult to predict as of now, but it would be interesting to see what happens to the housing prices when Fed would further increase the interest rates.
References:
- Ben Bernanke (2005, March 10). The Global Saving Glut and the U.S. Current Account Deficit. Retrieved from http://www.federalreserve.gov/boarddocs/speeches/
2005/200503102/ - Raghuram G. Rajan (2010). Fault Lines: How Hidden Fractures Still Threaten
- Eric Johnston (2006, January 9). Lessons from when the bubble burst. Re-
the World Economy.trieved from http://www.japantimes.co.jp/news/2009/01/06/reference/lessons-from-
when-the-bubble-burst/#.VxUaWNR97IW - Ed Crooks (2016, January 22) Oil: US shale’s big squeeze. Retrieved from
http://www.ft.com/intl/cms/s/0/2db96dae-c0eb-11e5-9fdb-
87b8d15baec2.html#axzz48u9L9qJZ - Emiko Terazono (2015, January 21). The price-supply disconnect. Retrieved
from http://www.ft.com/intl/cms/s/2/1ff55d66-9740-11e4-9636-
00144feabdc0.html?segid=0100320#axzz3PGgCWygP - The Economist (2014, December 6). In a blind. Retrieved from http://
www.economist.com/news/finance-and-economics/21635505-will-falling-oil-prices-curb-americas-shale-boom-bind
 About authors:
The author is a Banking and Financial Service student of batch 2015-17 at TAPMI. Her area of interest includes economics, banking, data analysis and digitalisation. She is also a senior analyst at Samnidhy. You can contact her at astha.bkfs17@tapmi.edu.in

The author is a Banking and Financial Service student of batch 2015-17 at TAPMI. His area of interest is mainly economics, banking, and risk management. He previously submitted his research paper on REGRESSIVE EXCHANGE RATE POLICY OF CHINA. He is on the editorial board of TJEF and also the member of Literary and Media Committee of TAPMI. You can contact him at nayan.bkfs17@tapmi.edu.in.


Leave a comment